Grade Equivalent Score Fallacy
NOTE: This blog post was originally written in 2014 when the WJ-III was still widely used. The score chart is based on hypothetical student test results run through official WJ scoring software. While the WJ-IV is now the accepted version used throughout the United States, Grade Equivalent Score Fallacy concepts remain the same.
Grade Equivalent scores remain one of the most misunderstood and misused pieces of data from educational testing. Rarely explained in a test report, parents who see “GE > 18.0” sometimes come away thinking their child is achieving at a post-graduate school level.
While a child who obtains such high GE scores can, no doubt, be categorized as intelligent; high GE scores do not automatically mean the child is ready to jump into graduate level courses on their own – especially if they’re only 12 years old.
The National Association of School Psychologists explains Age and Grade Equivalent scores simply:
[I]f Jacob’s performance on the test of reading comprehension is equal to an age equivalent of 8.7 years and a grade equivalent of 2.6, this means that his obtained raw score is equivalent to the same number of items correct that is average for all 8-year, 7-month old children included in the norm group on that particular reading comprehension test.
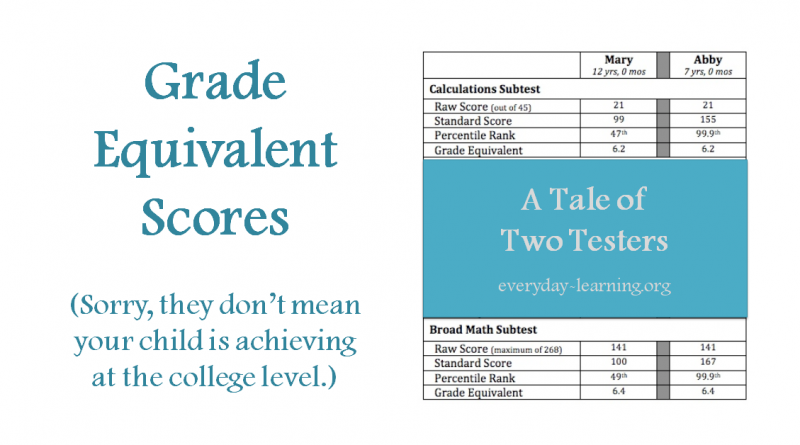
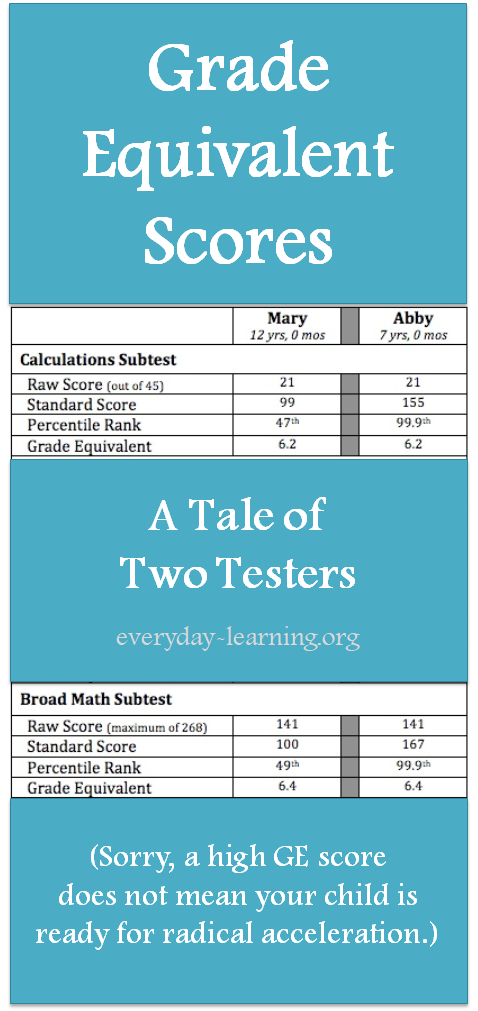
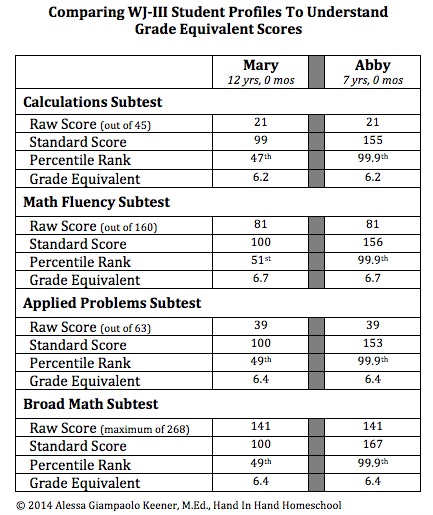
Let’s take a look at a couple of hypothetical test profiles to better understand Grade Equivalent scores.
Before I talk about these numbers in detail, let me give you a quick primer on some of the terminology.
Raw Score
Simply, Raw Score are the number of questions that were answered correctly on each subtest. Standardized tests do not report Raw Scores as simple percentages of correct answers.
Standard Score
Standardized tests mathematically transform each Raw Score into a Standard Score. A Standard Score of 100 is considered smack-dab Average. In fact, any Standard Score between 85 to 115, is considered Average.
Percentile Rank
If you want to compare a Standard Score to other test takers of the same age or grade, you can look at the Percentile Rank. For example, a Standard Score of 100 equates to a 50th Percentile Rank. Put another way, if you lined 100 kids up with highest to lowest Standard Scores, someone with a 100 would be standing on the 50th spot in that line. All the students standing in front of the child with the Standard Score of 100 will have achieved higher than that child. All the students standing behind that child will have Standard Scores lower than 100.
Grade Equivalent Scores
Grade Equivalent scores, on the other hand, allow us to compare the total number of correct answers the average test taker got. For example, an average 12-year old taking the 3 subtests that make up the Broad Math portion of the Woodcock Johnson-III Test of Achievement would need to get a total of 141 correct answers out of a total of 268 possible questions to score at the 50th Percentile. How that test taker got those 141 correct math answers will depend upon the individual.
For example, some people ace all their grade-level problems but then immediately get answers wrong when they encounter concepts they haven’t learned yet. Other students make careless mistakes on easy problems because they’re anxious to get to the more difficult – and more interesting – problems. Still other students have very inconsistent math skills and do extremely well in one area, such as calculations, but struggle with word problems. Just seeing a GE score doesn’t give you any insight into how the student obtained their Raw Scores.
So, back to the chart. Mary is our typical 12-year old girl. When we look at her math achievement scores we can feel rather confident that she’s achieving at grade level and is most likely doing well in her actual schoolwork.
Abby, on the other hand, is 7-years old, the typical age for a 2nd grader. Her achievement scores suggest she’s a pretty smart cookie. Some people may even take a look at her Grade Equivalent scores and think she’s a candidate for radical acceleration – but that’s not necessarily the case.
With Percentile Ranks of 99.9, we can say confidently that Abby is achieving, hands down, beyond expectations for 2nd grade. Abby would be an excellent candidate for gifted programming and probably even at least one grade skip.
However, just because her GE is in the 6th grade range in Calculations and Applied Problems, it does not mean she’s achieving at the 6th grade level – or even that she’s capable of accomplishing 6th grade level work, as of today.
Let me explain why.
The Woodcock Johnson Test of Achievement, just like the Wechsler Individualized Achievement Test, samples a person’s level of achievement across broad content areas. Neither test was designed to exhaustively assess if a person has learned all the goals, objectives, and content usually taught at each grade level. Tests like the Terra Nova and the Iowa Test of Basic Skills – criterion referenced tests – are the instruments we use to determine if a student has mastered a particular grade-level’s worth of material.
Take for example the Calculations subtest on the WJ-III. On this subtest, students have the opportunity to answer up to 45 math questions that range from basic addition to calculus. However, 22 of those questions focus on the four basic operations using only whole numbers. Only 2 questions assess calculus knowledge.
In the case of our hypothetical 7-year old Abby who answered 21 questions correctly on the Calculations subtests and earned a GE of 6.2, it’s possible that she aced all the basic operation problems, but failed to get one fraction or decimal problem correct, let alone even attempt a pre-algebra or higher math question. That doesn’t take away the fact that Abby is clearly ahead in math, but, at the same time, it doesn’t make the strongest case for saying that she should be in 6th grade math.
Grade Equivalent scores can be used to compare the number of correct answers children of different ages or grades received on the same test. Those Raw Scores, however, will lead to different Standard Scores based upon the test taker’s actual age or grade. Grade Equivalent scores do not tell us that a child is actually achieving at a specific grade level.
A high GE score tells us that a child has been able to correctly answer far more questions than his or her peers – but it tells us nothing more. At the same time, a high GE allows us to infer that the student more than likely has the ability to handle a greater breadth or depth of material than they are currently encountering, if they are in a typical age-grade placement.
Just how advanced the material should be is a question better judged by examining work samples and talking directly to the child. If you are attempting to advocate for a grade skip through a school, requesting that your child take the end-of-year assessment test for a specific grade level subject will provide you with stronger data.


Great article! Question about GE scores – If you have a child in first grade (rising second grader) where they are considering accelerating in math. Should that child be compared to second grade (rising third grader) or a third grade student? In other words, which “GE” would be appropriate in this situation?
Hi Kristi. In the case where a child is partially or whole-grade accelerated, then I would recommend scoring the individualized achievement testing using age norms. In other words, instead of comparing the child against other children in either 1st, 2nd, or 3rd grade, the child is compared to children who are the same age.
Remember, GE scores don’t really give a parent any useful information regarding grade placement. GE scores only tell you how your child compared to other students for how many correct answers they got. The child’s Standard Score and the associated Percentile Rank are what is most helpful in determining if acceleration is a good choice.
Grade Equivalent scores remain one of the most misunderstood and misused pieces of data from educational testing.